Winners / Selection Rationale
Matsui Securities Co., Ltd.
2001 1st Porter Prize Winner Securities business
Making a conscious choice about “what not to do,” and choosing to specialize in credit transaction services for individuals
Trade-offs
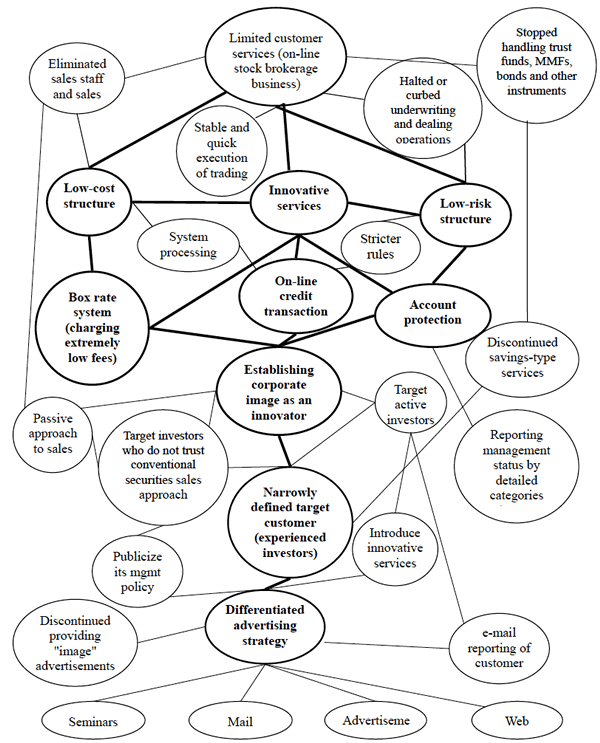
What should be noted about Matsui Securities' competitive strategy is its clarity regarding trade-offs. Trade-offs refer to a relationship in which you must give up something in order to gain another option. In other words, a trade-off requires a person to make a conscious choice regarding what to do and what not to do. Matsui Securities has chosen as its target customers only those individuals with considerable trading experience, and the company provides securities trading services to individuals (especially for credit transactions). The company has decided not to offer its services to corporate customers or individuals with little experience, who would require consultations. It also does not offer services related to stock investment trusts, mini-stocks, cumulative investments, and MMFs, all of which require product explanations. By choosing not to deal with such customers, nor to provide the aforementioned services, Matsui Securities was able to eliminate various other standard business features, such as sales offices and staff, consultations and other services, and eventually its call center. First, the Company closed all its sales offices, and dismissed sales staff and transferred consultation functions to a call center. Later, it switched over to an on-line transaction service, and ended up closing the call center as well. By choosing to eliminate these features, Matsui Securities established a low-cost structure that could not be matched by a full-line securities firm. Furthermore, Matsui chose to specialize in credit transactions for individuals. The company was able to develop specialized systems for executing such transactions, and provided information to customers on-line regarding their transaction status and their current asset balance. As a result, the company was able to reduce its brokerage fee structure, or box rate, to as low as \3,000. Matsui Securities achieved both a Return on Invested Capital and a Return on Sales that are much higher than the industry average, and these gaps are widening each year.
Unique Value Provision
Matsui Securities has clearly differentiated itself from full-line securities businesses. How, then, was Matsui Securities able to establish an overwhelmingly dominant position among on-line securities companies? Matsui ranks top in the securities industry for its credit transaction volume, and the company has the top market share among on-line securities businesses. Matsui was able to achieve a competitive advantage by targeting a totally different customer segment than other on-line securities companies, and by providing its customers with unique value that cannot be delivered by any other competitors. Matsui's target customers are individuals aged 40-70, who actively engage in stock trading. The unique value that Matsui Securities delivers to such clients is an abundant supply of objective information, in addition to the convenience of on-line trading and a low box rate of \3,000. Credit transactions are complex and inherently involve risk. Matsui, however, has simplified risk management for its clients by applying strict rules that have been built into the company's in-house developed transaction system. Matsui Securities draws on a wealth of experience amassed during its 80-year history, as well as an extensive knowledge of the investment behavior of Japanese individual investors, and the securities market informs all of its activities. (Please refer to the attached "Activity System Map" for a more detailed account of the interrelationship of these activities.)
Return on invested capital (ROIC) (Unit = percentage point)
Return on invested capital = Operating income / Average invested capital
Return on sales (ROS) (Unit = percentage point)
Return on sales =Operating income / Net sales
Return on invested capital (ROIC) (Unit = percentage point)
| Difference from industry averag over 4 year period |
Difference from industry average, by year | ||||
| 1997 | 1998 | 1999 | 2000 | ||
| 18.45%P | 7.74%P | 9.34%P | 28.57%P | 29.67%P | |
Return on sales (ROS) (Unit = percentage point)
| Difference from industry average over 4 year period |
Difference from industry average, by year | ||||
| 1997 | 1998 | 1999 | 2000 | ||
| 20.13%P | 21.96%P | 22.59%P | 10.19%P | 37.94%P | |
Activity System Map

Winners PDF
- 2001 Porter Prize Winners PDF (All of the award company in this year are published. )


