Winners / Selection Rationale
Canon, Inc.
2001 1st Porter Prize Winner Development, manufacturing and sales of lens units
Using its grasp of the needs of small and medium enterprises and its exceptional financing capability to cross-sell 40 types of financial products and services through offices located across the nation
Company Outline
At Canon, Inc., the Lens Division is responsible for the development, manufacturing and sales of lenses and lens units that become one of the key modules of single-lens reflex cameras, digital cameras, video cameras, copying machines, laser-beam printers, facsimile machines, image scanners, security cameras, and LCD projectors.
Consistency of Strategy Over Time
What is remarkable about the competitive strategy of Canon's Lens Division is the consistency of its strategy and the continuity of its innovations. From the company's earliest days, the Lens Division has focused on its key components -- lenses and lens units -- and extended its frontier into new fields through innovation. More specifically, it developed the electronic technology necessary for controlling the lens, such as auto-focusing, sight-line input devices, and anti-shake systems, among others, and moved into new usage areas that require even further miniaturization and better functionality, by developing new materials or by altering the design altogether. The Lens Division's strength in technological innovation is also demonstrated by the number of registered patents the company holds. In the category of zoom lenses, Canon has registered twice as many patents as its competitors since 1993, and the company currently accounts for 38% of all patents registered in this category. Furthermore, the extent to which Canon is able to realize practical applications of this technology is truly remarkable. The average number of areas for commercial application of lenses and lens units for the 20 major lens manufacturers in Japan and abroad is only 2.9, whereas Canon's Lens Division supplies units for as many as 8 areas.
Fit among Activities
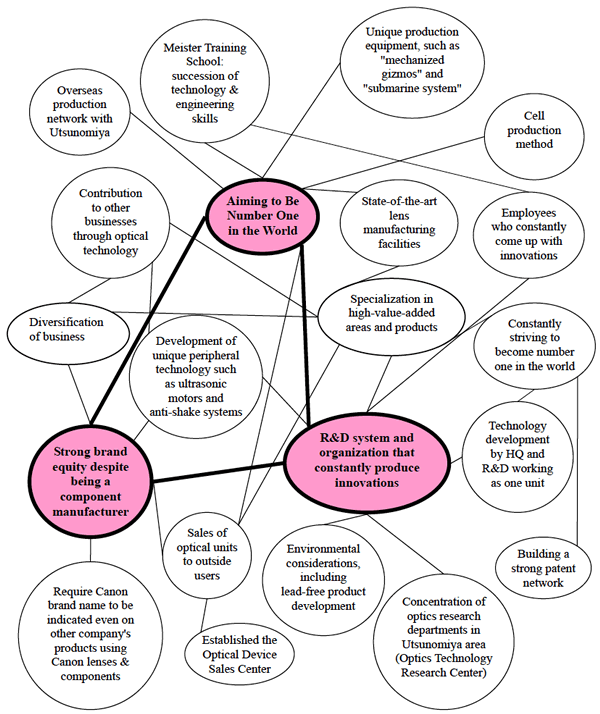
Canon's continuous innovations were made possible by its unique activity system. For one thing, Canon consolidated optical R&D units that previously had been dispersed throughout its various product divisions, and created the Lens Division. Canon's lenses have become a major differentiating factor, not only for single-lens reflex cameras but also for other products, such as digital cameras and projectors. With product divisions that require lenses as its key component, Canon's history has been fueled by technological innovations in both products and lenses. Furthermore, Canon created a work environment that would accelerate the integration of innovations in lens technologies in various products by locating the research and development staff in a single location so that they may work closely with the product divisions. Another aspect of Canon's activity system lies in the development of production technology. Leveraging the sophisticated skills of production engineers who had been polishing lenses with precision measured in microns, Canon combined such skills with design theory, precision machining technology, and precision measurement technology. (Please refer to the attached "Activity System Map" for a more detailed account of interrelationship of these activities.)
Canon's Lens Division has made a conscious effort to utilize its technological superiority in branding, and despite being a component, the Canon lens is recognized as a strong global brand.
As a result, the Lens Division of Canon, Inc. has achieved a high Return on Invested Capital and a Return on Sales that far exceeds the industry average, and these margins are still widening.
Return on invested capital (ROIC) (Unit = percentage point)
Return on invested capital = Operating income / Average invested capital
Return on sales (ROS) (Unit = percentage point)
Return on sales =Operating income / Net sales
Canon's Lens Division has made a conscious effort to utilize its technological superiority in branding, and despite being a component, the Canon lens is recognized as a strong global brand.
As a result, the Lens Division of Canon, Inc. has achieved a high Return on Invested Capital and a Return on Sales that far exceeds the industry average, and these margins are still widening.
Return on invested capital (ROIC) (Unit = percentage point)
| Difference from industry averag over 4 year period |
Difference from industry average, by year | ||||
| 1997 | 1998 | 1999 | 2000 | ||
| 6.40%P | -0.35%P | 4.99%P | 2.75%P | 18.37%P | |
Return on sales (ROS) (Unit = percentage point)
| Difference from industry average over 4 year period |
Difference from industry average, by year | ||||
| 1997 | 1998 | 1999 | 2000 | ||
| 5.94%P | 2.46%P | 5.27%P | 3.17%P | 11.21%P | |
Activity System Map

Winners PDF
- 2001 Porter Prize Winners PDF (All of the award company in this year are published. )


