Winners / Selection Rationale
MABUCHI MOTOR CO., LTD.
2001 1st Porter Prize Winner Development, manufacturing and sales of micro motors
Continuous implementation of a standardization strategy for small DC brush motors spanning half a century, and maintenance of the top position in the global market.
Consistency of Strategy Over Time
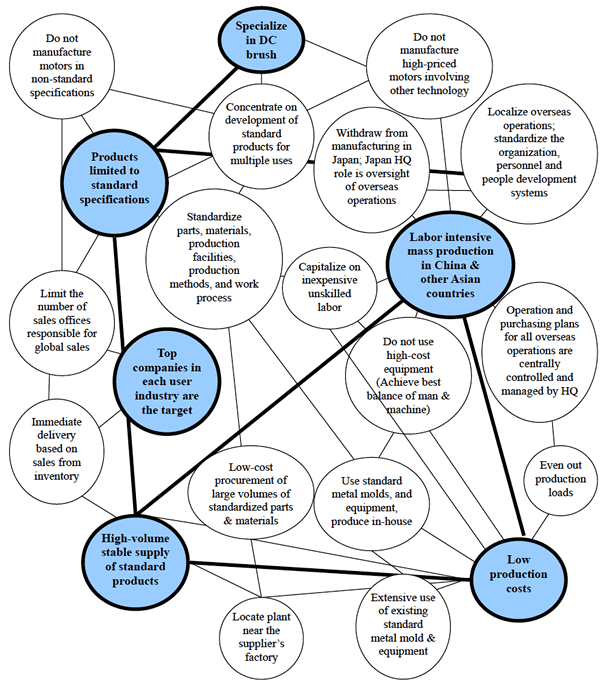
Regarding the competitive strategy of Mabuchi Motor, continuity of its standardization strategy deserves special mention. Originally, a common practice of the small motor industry had been to customize the motor design to meet every customer requirement. In the early 1970s, Mabuchi Motor discontinued this practice, and instead pursued product standardization. Ever since then, Mabuchi has persistently worked to achieve more thorough implementation of this standardization strategy. It is easy to see that the degree of standardization in Mabuchi Motor is exceptionally higher than at other motor manufacturers, as demonstrated by the fact that the production volume per model at Mabuchi is equivalent to the total production volume of all the other competitors combined.
Unique Value Proposition
For Mabuchi, standardization has resulted in lower production costs, uniform quality, and the flexibility to increase supply to meet rapid surges in demand, factors which continue to be the source of the company's competitiveness. Standardization yielded further synergies with the commencement of production in Hong Kong in 1964. Standardization made it easier to undertake production in Hong Kong, and enabled the simultaneous achievements of low-cost operations and the manufacture of products of a uniform quality. As products became standardized, the company could maintain a stock of inventory at a reasonable cost, which in turn enabled the company to supply large-volume orders at short notice. (Please refer to the attached "Activity System Map" for a more detailed account of the interrelationship of these activities.) Although Mabuchi Motor has a strong capability for low-cost manufacturing, it has been able to avoid price wars because of the uniformly high quality of its products and its capability to fill large-volume orders. As a result, Mabuchi's return on sales (ROS) is much higher than the industry average.
Dynamics of the Strategy
Mabuchi Motor has maintained more than a 50% share of the global market for small DC brush motors for over several decades. Standardization essentially requires the sacrifice of customer satisfaction to some extent, in that products can no longer be tailored to meet any one customer's specifications. Mabuchi, however, has been able to maintain its competitiveness, firstly, because it targeted users whose products do not require the customization of motors.
Secondly, Mabuchi has constantly been cultivating new market segments while adhering to its strategy of standardization. The users Mabuchi currently serves include manufacturers of audiovisual equipment, automotive products, home appliances, power tools, and precision machinery and office equipment, as well as toys and models. The expansion of user segments was possible only through the continuous redefining of standardization contents. Mabuchi focused specifically on small DC motor with contact brushes. The company has been working on this product since the company's founder Kenichi Mabuchi invented a small horseshoe-shaped magnet motor in 1947. The company specialized in this technology, and continuously improved it to make sure that its products would meet the functional and precision requirements of new user segments.
Return on invested capital (ROIC) (Unit = percentage point)
Return on invested capital = Operating income / Average invested capital
Return on sales (ROS) (Unit = percentage point)
Return on sales =Operating income / Net sales
Secondly, Mabuchi has constantly been cultivating new market segments while adhering to its strategy of standardization. The users Mabuchi currently serves include manufacturers of audiovisual equipment, automotive products, home appliances, power tools, and precision machinery and office equipment, as well as toys and models. The expansion of user segments was possible only through the continuous redefining of standardization contents. Mabuchi focused specifically on small DC motor with contact brushes. The company has been working on this product since the company's founder Kenichi Mabuchi invented a small horseshoe-shaped magnet motor in 1947. The company specialized in this technology, and continuously improved it to make sure that its products would meet the functional and precision requirements of new user segments.
Return on invested capital (ROIC) (Unit = percentage point)
| Difference from industry averag over 4 year period |
Difference from industry average, by year | ||||
| 1997 | 1998 | 1999 | 2000 | ||
| 9.72%P | 10.30%P | 14.96%P | 11.27%P | 5.95%P | |
Return on sales (ROS) (Unit = percentage point)
| Difference from industry average over 4 year period |
Difference from industry average, by year | ||||
| 1997 | 1998 | 1999 | 2000 | ||
| 19.98%P | 17.14%P | 22.12%P | 22.51%P | 20.61%P | |
Activity System Map

Winners PDF
- 2001 Porter Prize Winners PDF (All of the award company in this year are published. )


